Introduction
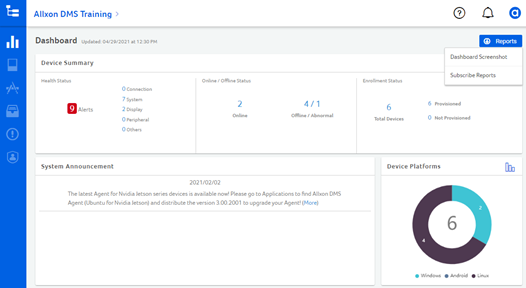
Allxon centers its focus on making remote device management easy. On the Dashboard page, you have a quick and comprehensive overview of the different statuses, platforms, and locations of your devices. System announcements also keep you in the loop for new system updates.
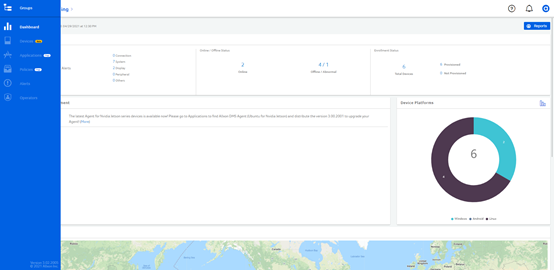
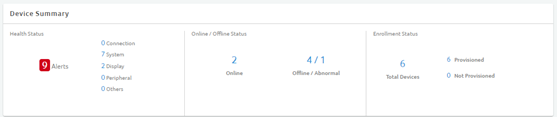
2.1 Device Summary
- Health Status: alerts on abnormal device system temperatures, CPU, memory, and storage usages. Learn how to set device alerts in 7 Alerts.
- Connectivity Status: indicates the number of devices that are online, offline, or abnormal.
- Enrollment Status: indicates the number of devices that are provisioned or not provisioned.
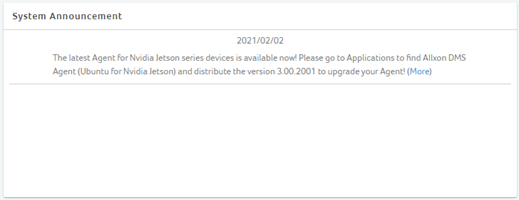
2.2 System Announcements
Allxon keeps up-to-date with the market’s pain points and constantly works on refining its users’ experiences with simpler operations management solutions. The System Announcement section informs you on the latest news and updates about Allxon Portal and Agent.
2.3 Device Platforms
The Device Platforms shows you the number of devices that are connected across different operating systems.
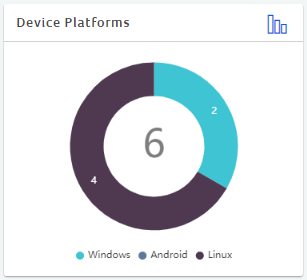
Click on the icon to customize your Device Platforms display by toggling between pie chart view and bar chart view.
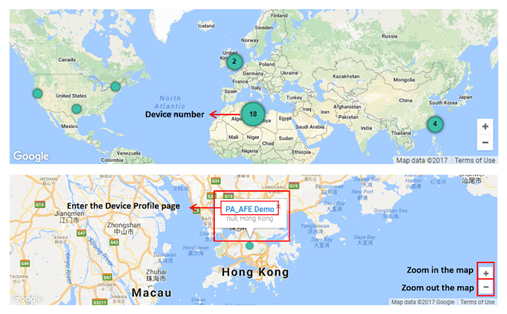
2.4 Device Locations
A map data layout gives you a bird’s-eye-view of all the devices you are connected to and operating on around the world. The name of each device and the number of devices are presented in clusters. Zoom in (click on “+”), zoom out (click on “-”), and mouse over a country or city on the map to show details of each device. You can also click on the device name for quick entry to the Device’s Profile page.
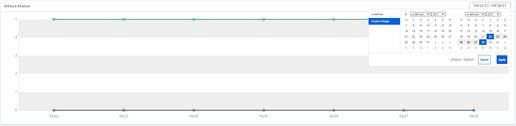
2.5 Device Status
A line graph is used to present the status of your devices over a period of time. Click on the dates to select time range, and mouse over each data point for more information about the total number of devices that are ready for use (provisioned) or not ready for use (unprovisioned).
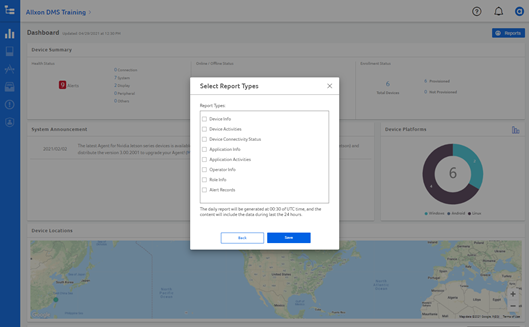
2.6 Reports
Allxon Portal includes useful tools to make it easy for you to keep records of your business and device operations. Click on Reports to take quick screenshots of your dashboard, or you can Subscribe to daily reports to help review operation performance.
Daily reports are saved as CSV files and kept on the Portal for 30 days. You can also choose to download the daily reports by selecting the report types. Reports are generated at 00:30 of UTC time and include a detailed performance report of the last 24 hours.