Let’s Get Started!
>Head over to Device Details Page, and click on the Tegrastats tab.

1. Plugin Overview
You can set up and monitor multiple general information such as performance monitoring, performance tuning, and alert configuration in the Commands, States, Charts, and Alert Settings cards.
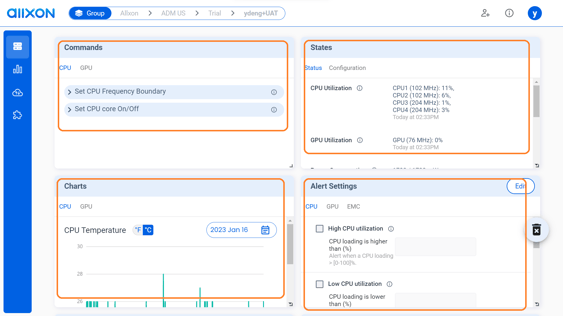
2. Performance Monitoring
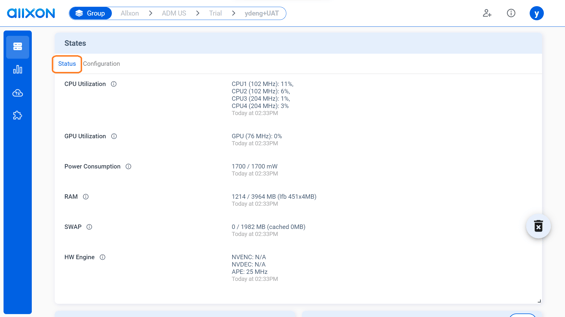
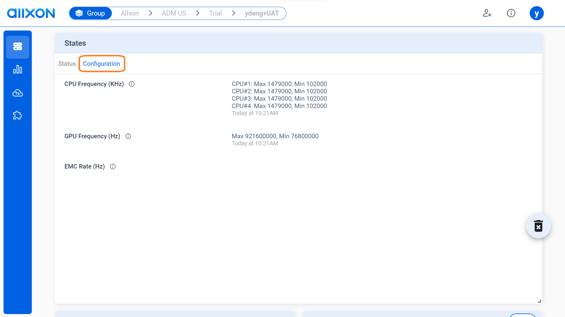
- You can monitor the CPU/GPU Status such as utilization, power consumption, RAM, and the CPU/GPU Configuration such as frequency, EMC rate in the States card.
- You can monitor the CPU/GPU Temperature, Utilization and Power Consumption, and you can select the date range according to your preference in the Charts card.

![]() Notice:
Notice:
The information displayed in the States card is updated roughly once per minute.
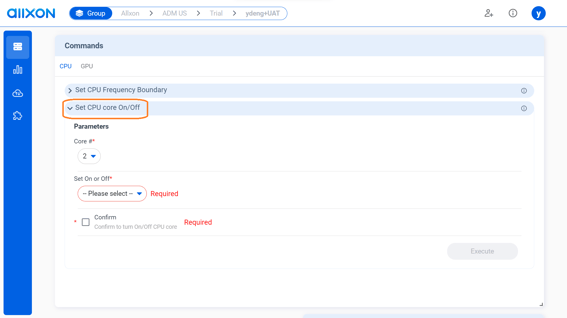
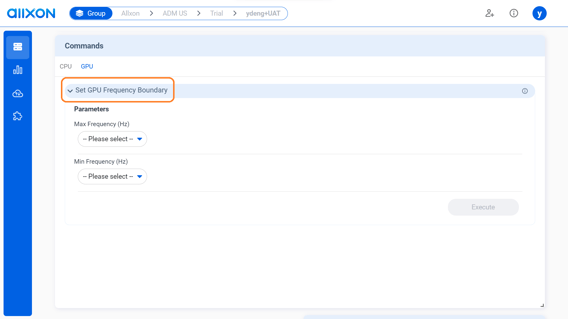
3. Performance Tuning
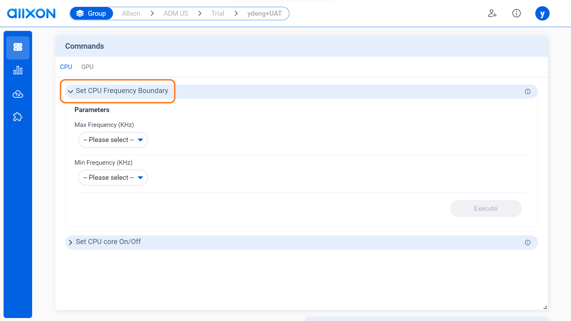
Click on each of the dropdown lists to set up CPU/GPU Frequency Boundary and CPU core switch mode in the Commands card.
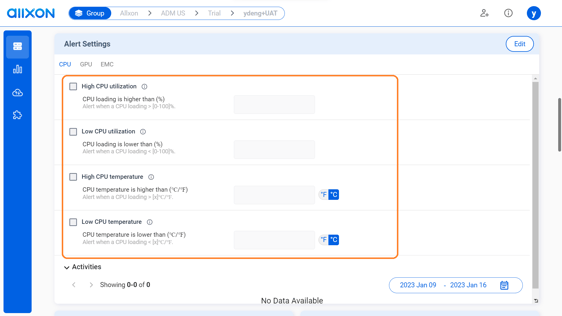
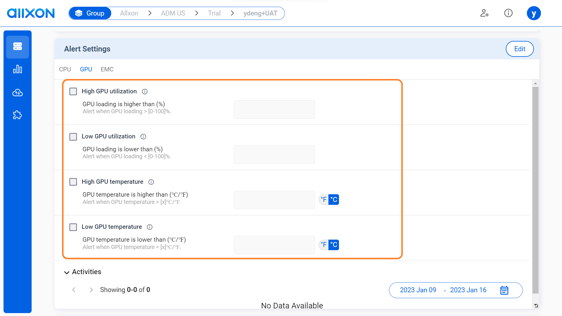
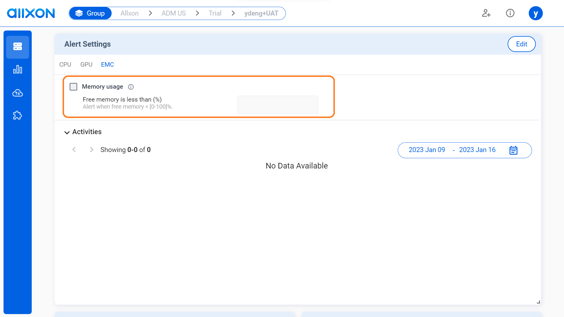
4. Real-Time Alert Setting
Set up alerts for CPU/GPU utilization, temperature, and memory usage in the Alert Settings card, and get real-time notification via email, LINE, and Webhook.
💡 Note: You will first need to configure your SMTP, LINE, or Webhook settings before setting up the alert item and alert recipients via the Portal.
See What are alerts? for more alert setting information.
You’re All Set!